![]()
Q1 2018 Market Summary
Submitted by First & Main Financial Planners - East Bay Area: Oakland, CA on August 1st, 2018
2017:
37.50% - U.S. momentum stocks 7.77% - Global high yield bonds
36.55% - Emerging markets stocks 4.66% - Core bonds
28.05% - International core stocks 2.14% - Core municipal bonds
21.73% - U.S. large stocks
9.59% - U.S. small value stocks
Q1 2018
2.97% - U.S. momentum stocks -5.23% - Global high yield bonds
1.68% - Emerging markets stocks -0.74% - Core bonds
-0.96% - International core stocks -0.38% - Core municipal bonds
-0.78% - U.S. large stocks
-2.19% - U.S. small value stocks
If you look only at the performance numbers above you might think that compared to 2017 the first quarter was uneventful. Most issues are down YTD, but only a few percent. Let’s take a look at what happened over the quarter in our small cap value fund.
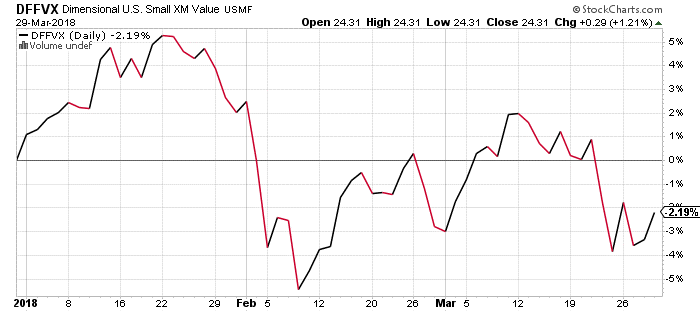
A wild ride indeed.
We saw follow-through in January from last year’s run up. A sharp pullback in February driven by traders unwinding leveraged bets against volatility and rising interest rates. In March we have seen a swoon driven by fears of a trade war driven by tariffs as well as a tech selloff.
This makes for interesting reading, but really has little to do with our overriding investment philosophy: invest for the long (really long) term, invest in baskets of stocks that we expect to outperform over these long periods, and filter out the noise. To put some perspective on this let’s look at a 5 year chart for the same fund:
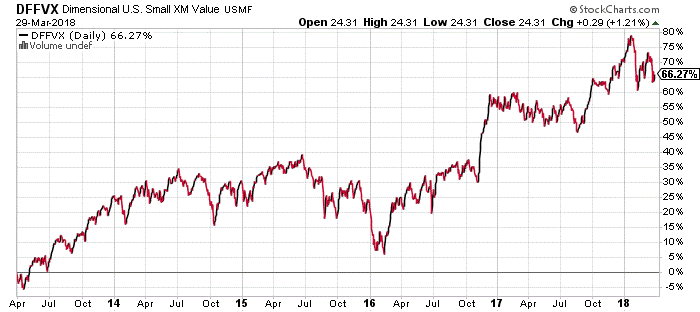
The recent volatility is put into perspective in this chart; it’s noticeable, but small and definitely not unusual.
As always, we truly appreciate the confidence you’ve place in us with your assets and I want you to feel free to call at any time regarding your portfolio or any personal financial matter.
Sincerely,
Erik S. Wolfers, MBA, CFP®